Skip to content
Courses
Blog Posts
Tag:
#equity
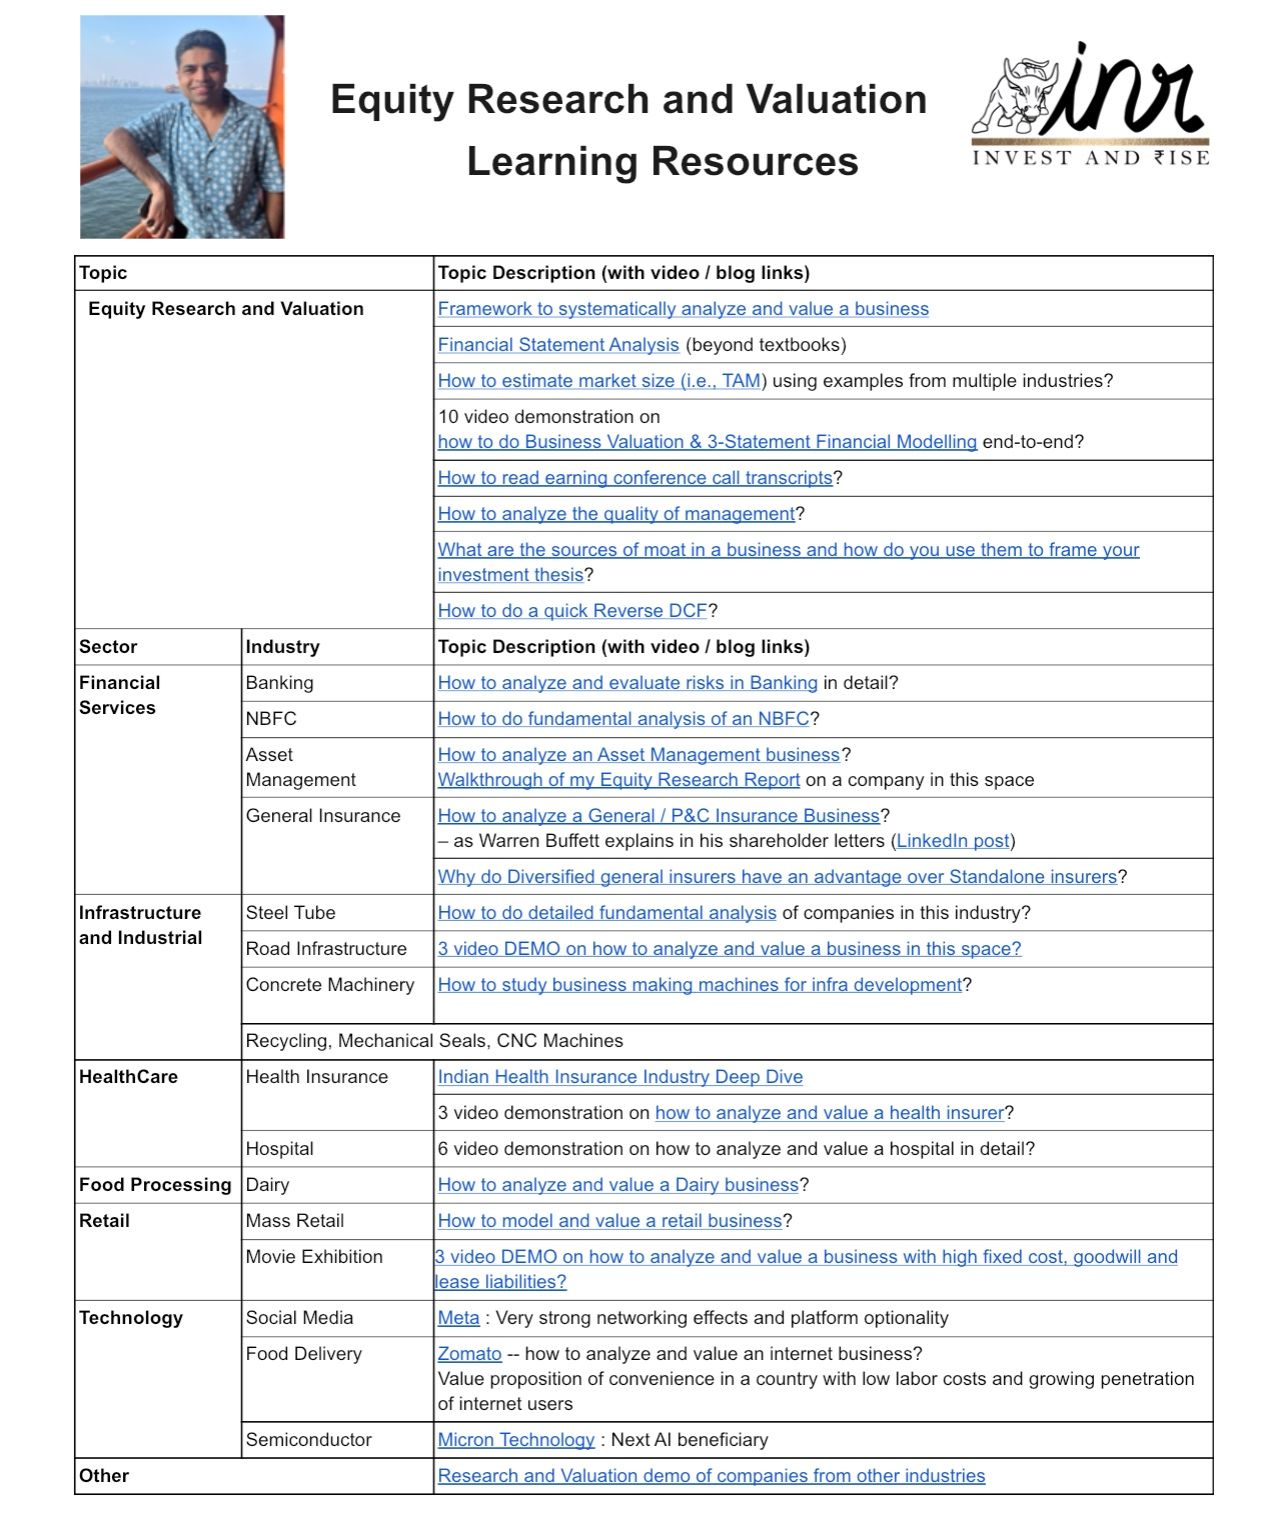
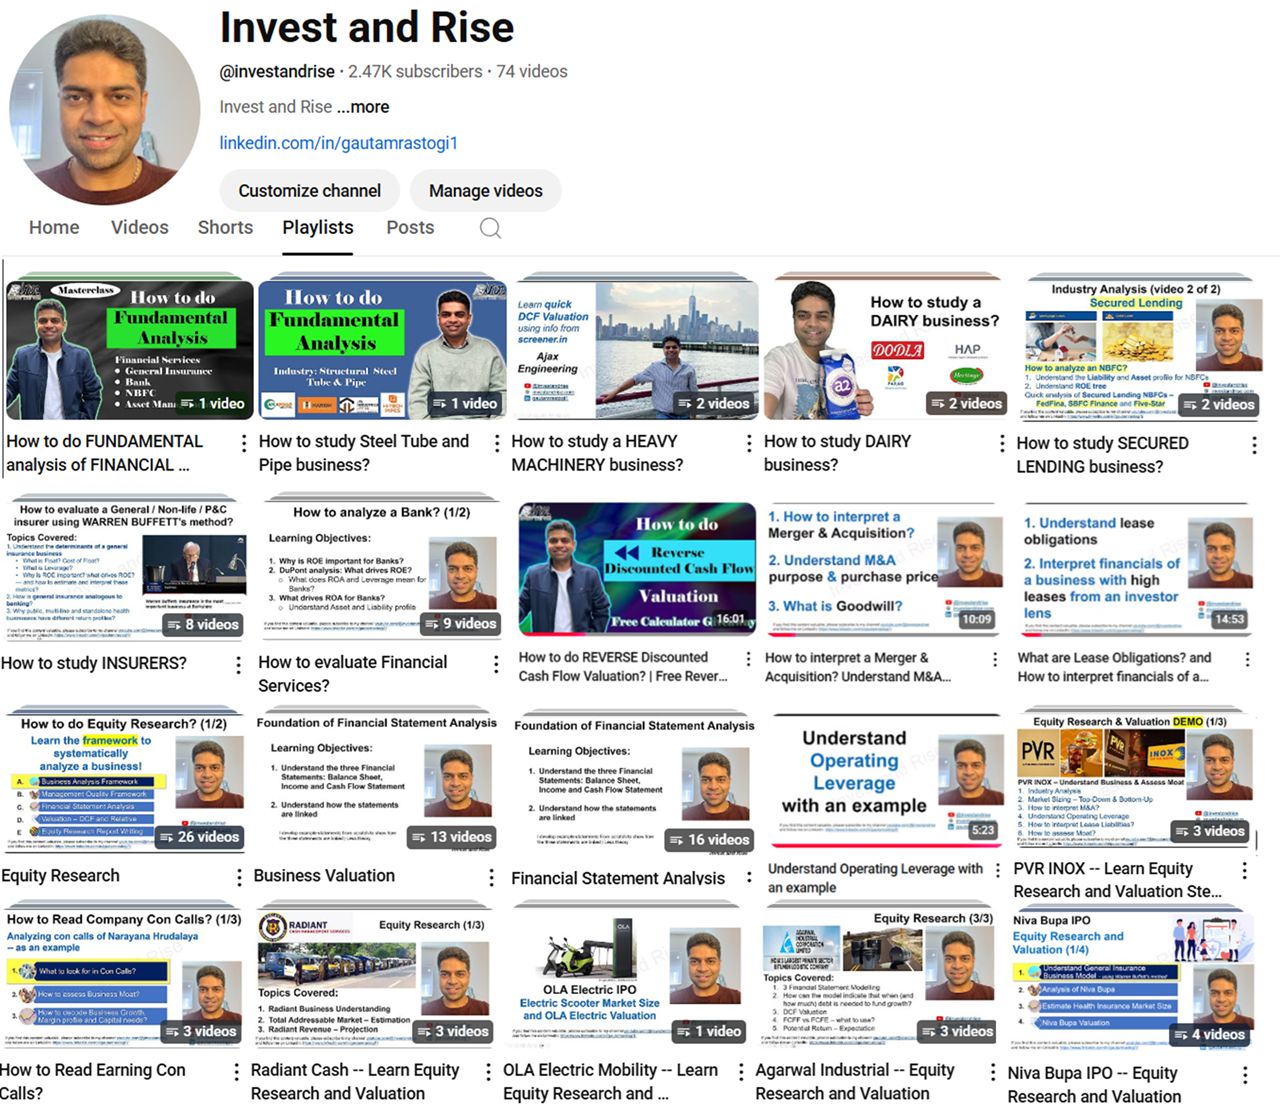
Resources for Investors, Equity Analysts, and Strategy Consultants
Sep 9, 2025
Resources to help investors, aspiring equity research analysts and finance focused strategy consultants
Sep 9, 2025
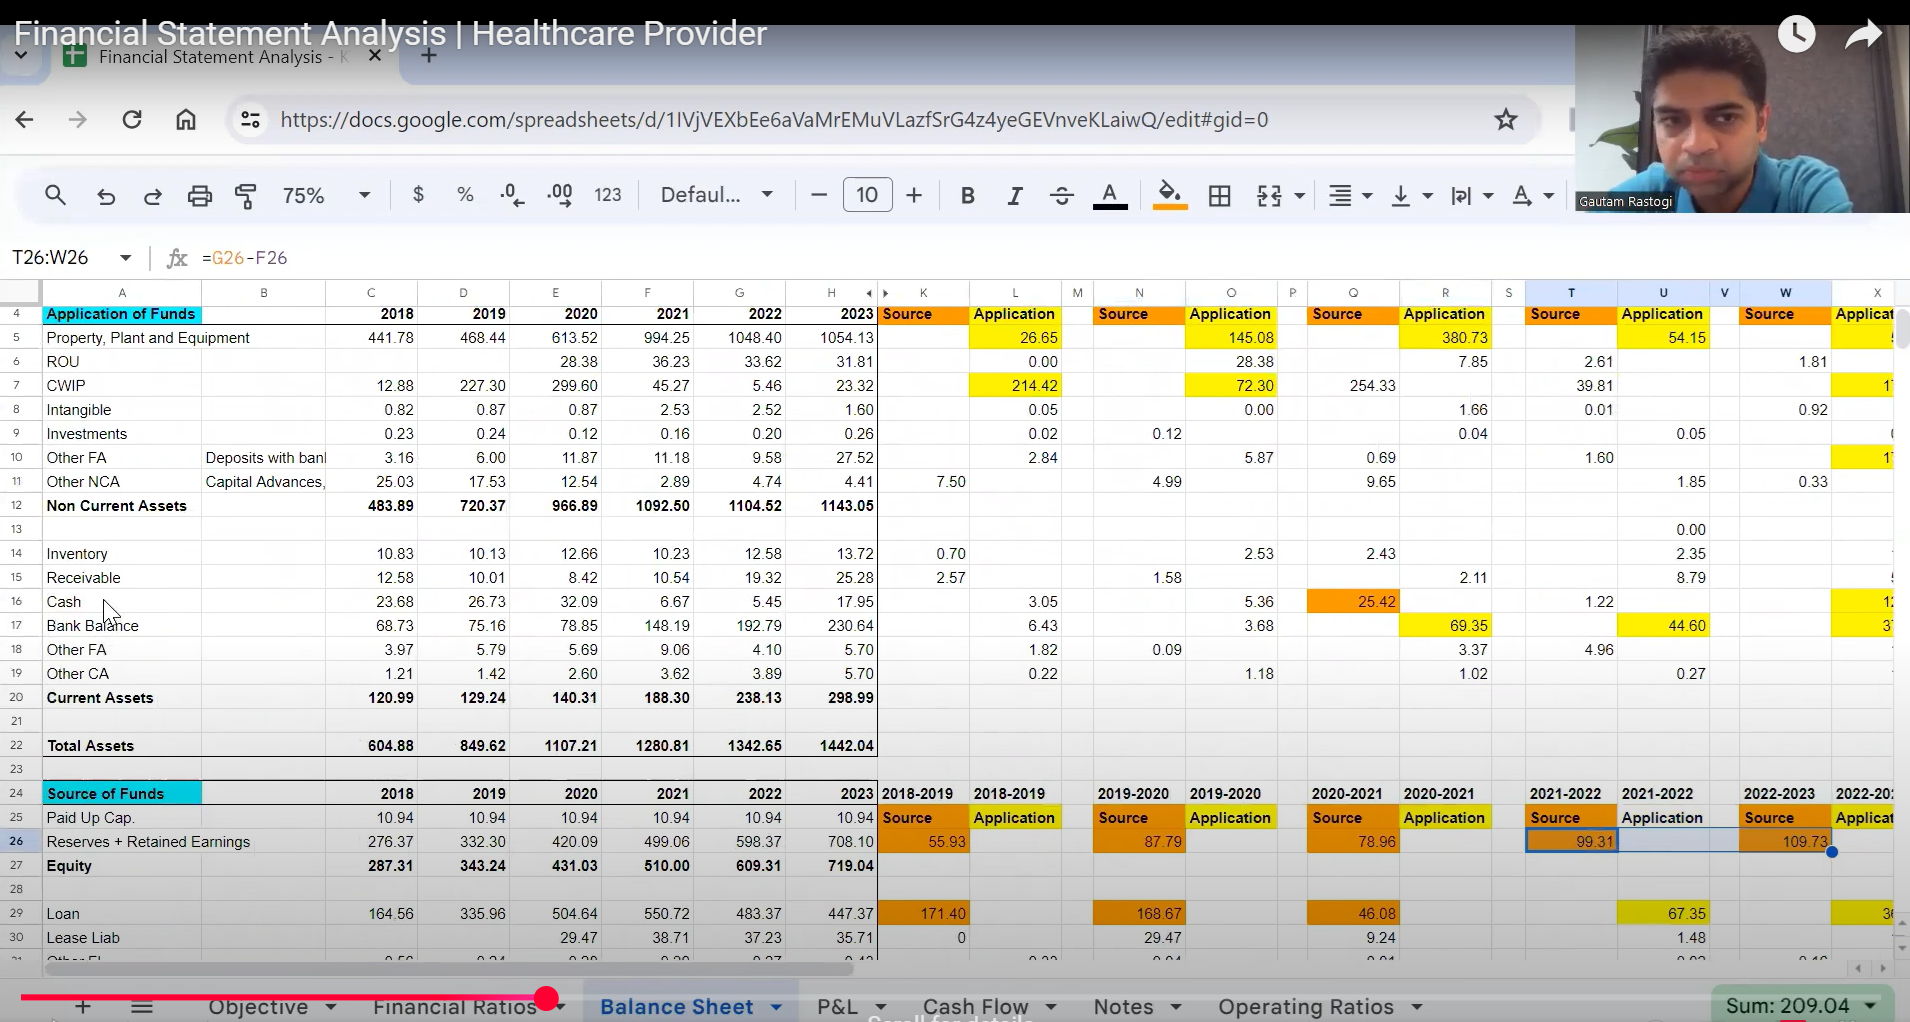
Financial Statement Analysis
Jun 20, 2024
Equity Research | Agarwal Industrial Corp Ltd
Jun 20, 2024
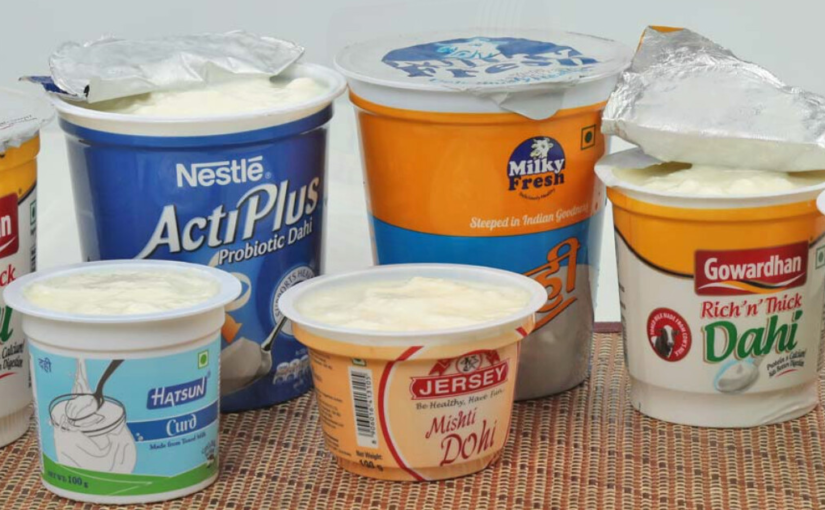
My notes on Rajshree Polypack, a company that makes packaging for F&B industry
Dec 21, 2023
Oriental Carbon and Chemicals – Indian company operating in an Oligopoly
Jun 30, 2023
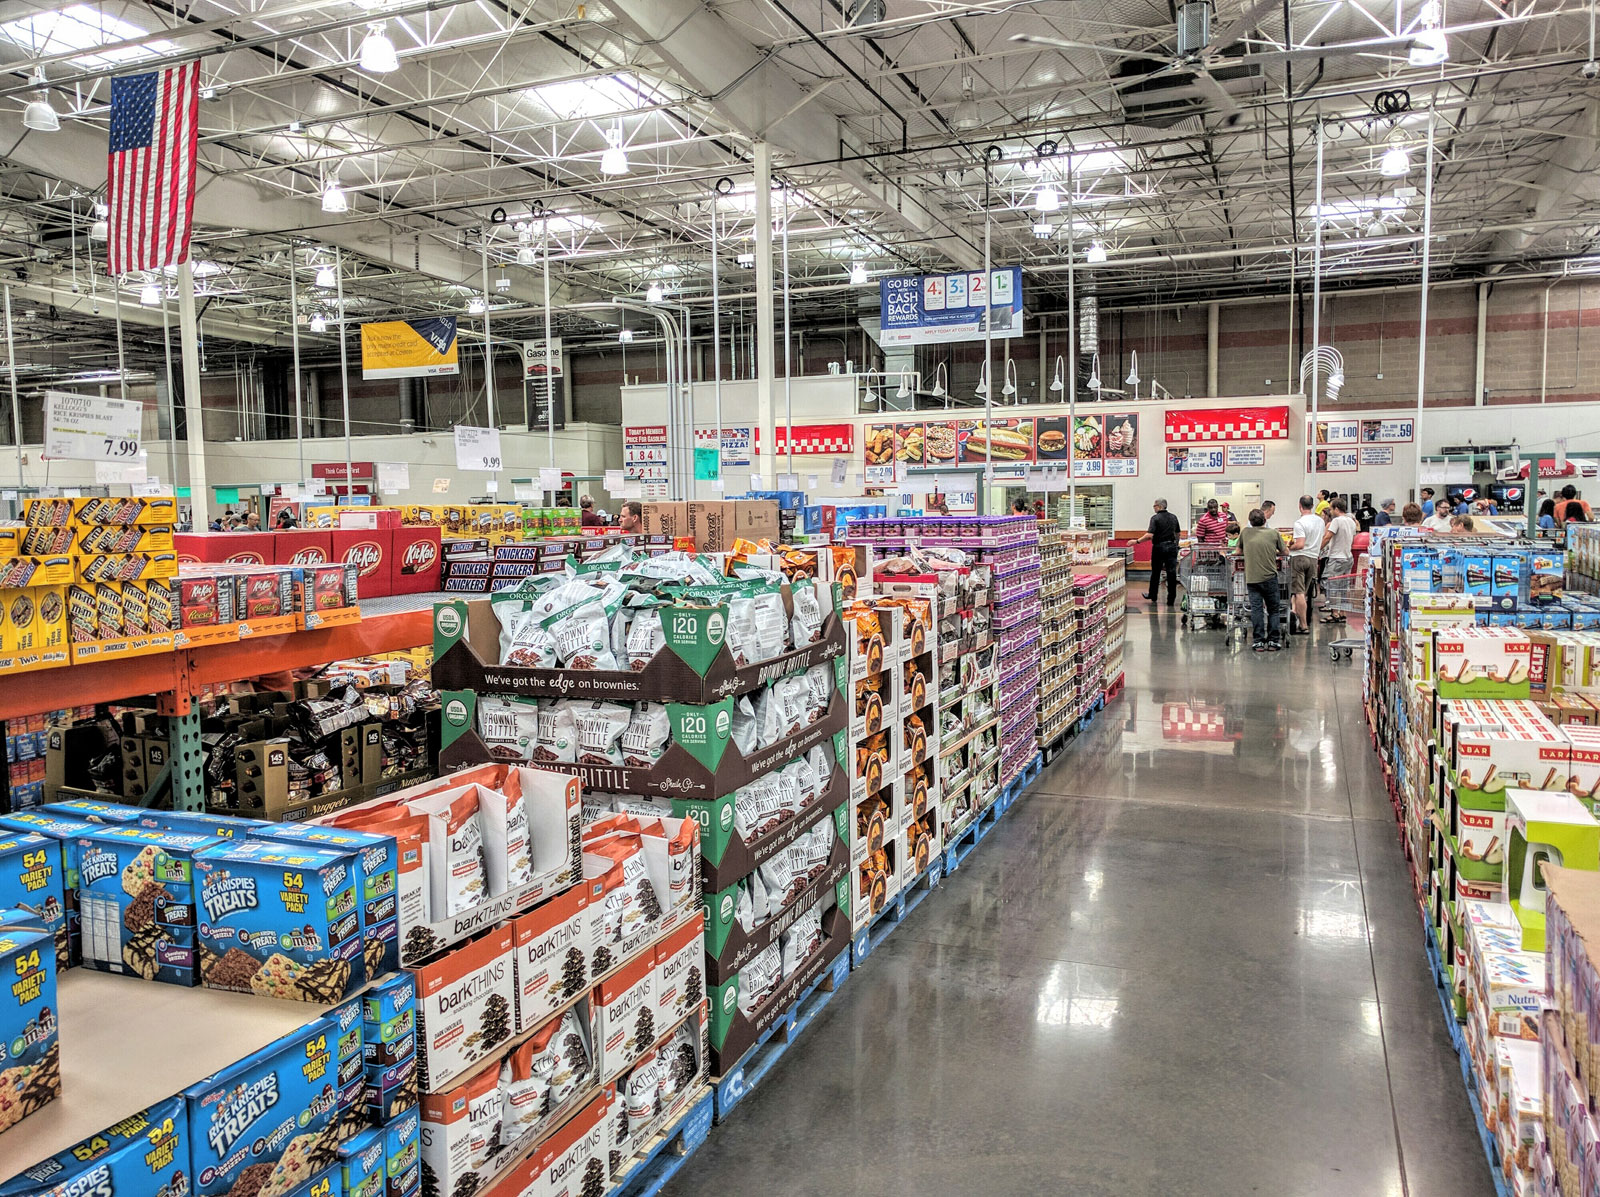
Costco Equity Valuation
Jun 13, 2020
Value in Facebook
Jan 2, 2020
Bandhan and Gruh Merger Valuation
Dec 15, 2019
Bandhan Bank Valuation (just prior to merger with Gruh)
Dec 4, 2019
1
2
Next Page
Connect with us
Please enable JavaScript in your browser to complete this form.
Please enable JavaScript in your browser to complete this form.
Name
*
First
Last
Email
*
Email or Name
Comment or Message
Submit
CLOSE