Skip to content
Courses
Blog Posts
Tag:
DCF
Business Valuation Education Video Series
Jan 26, 2024
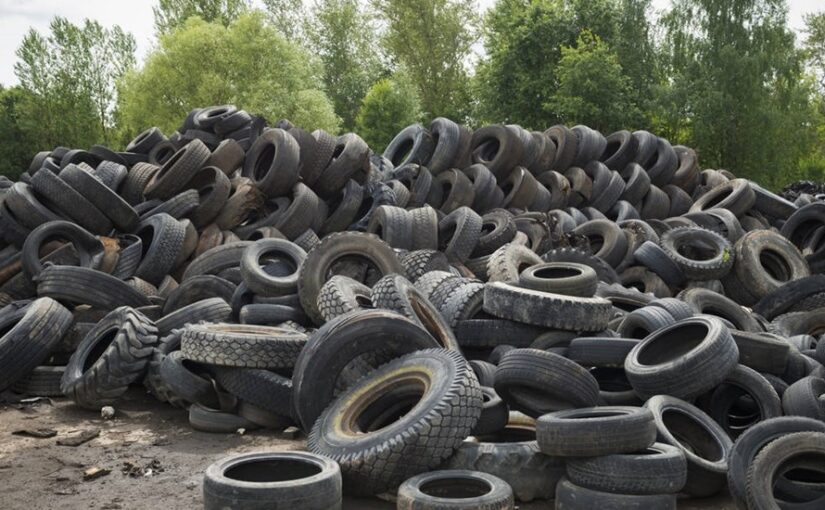
My notes on Tinna Rubber, a company that recycles tyres
Dec 5, 2023
Value in Facebook
Jan 2, 2020
Bandhan and Gruh Merger Valuation
Dec 15, 2019
Bandhan Bank Valuation (just prior to merger with Gruh)
Dec 4, 2019
Connect with us
Please enable JavaScript in your browser to complete this form.
Please enable JavaScript in your browser to complete this form.
Email Name or
Name
*
First
Last
Email
*
Comment or Message
Submit
CLOSE