Skip to content
Courses
Blog Posts
Tag:
#equityresearch
Free Webinar: Fundamental Analysis and Valuation DEMO of Ganesha Ecosphere
Sep 10, 2025
Concept of Operating (De) Leverage explained through movies!
Sep 10, 2025
How to estimate market size–top-down and bottom-up?
Sep 9, 2025
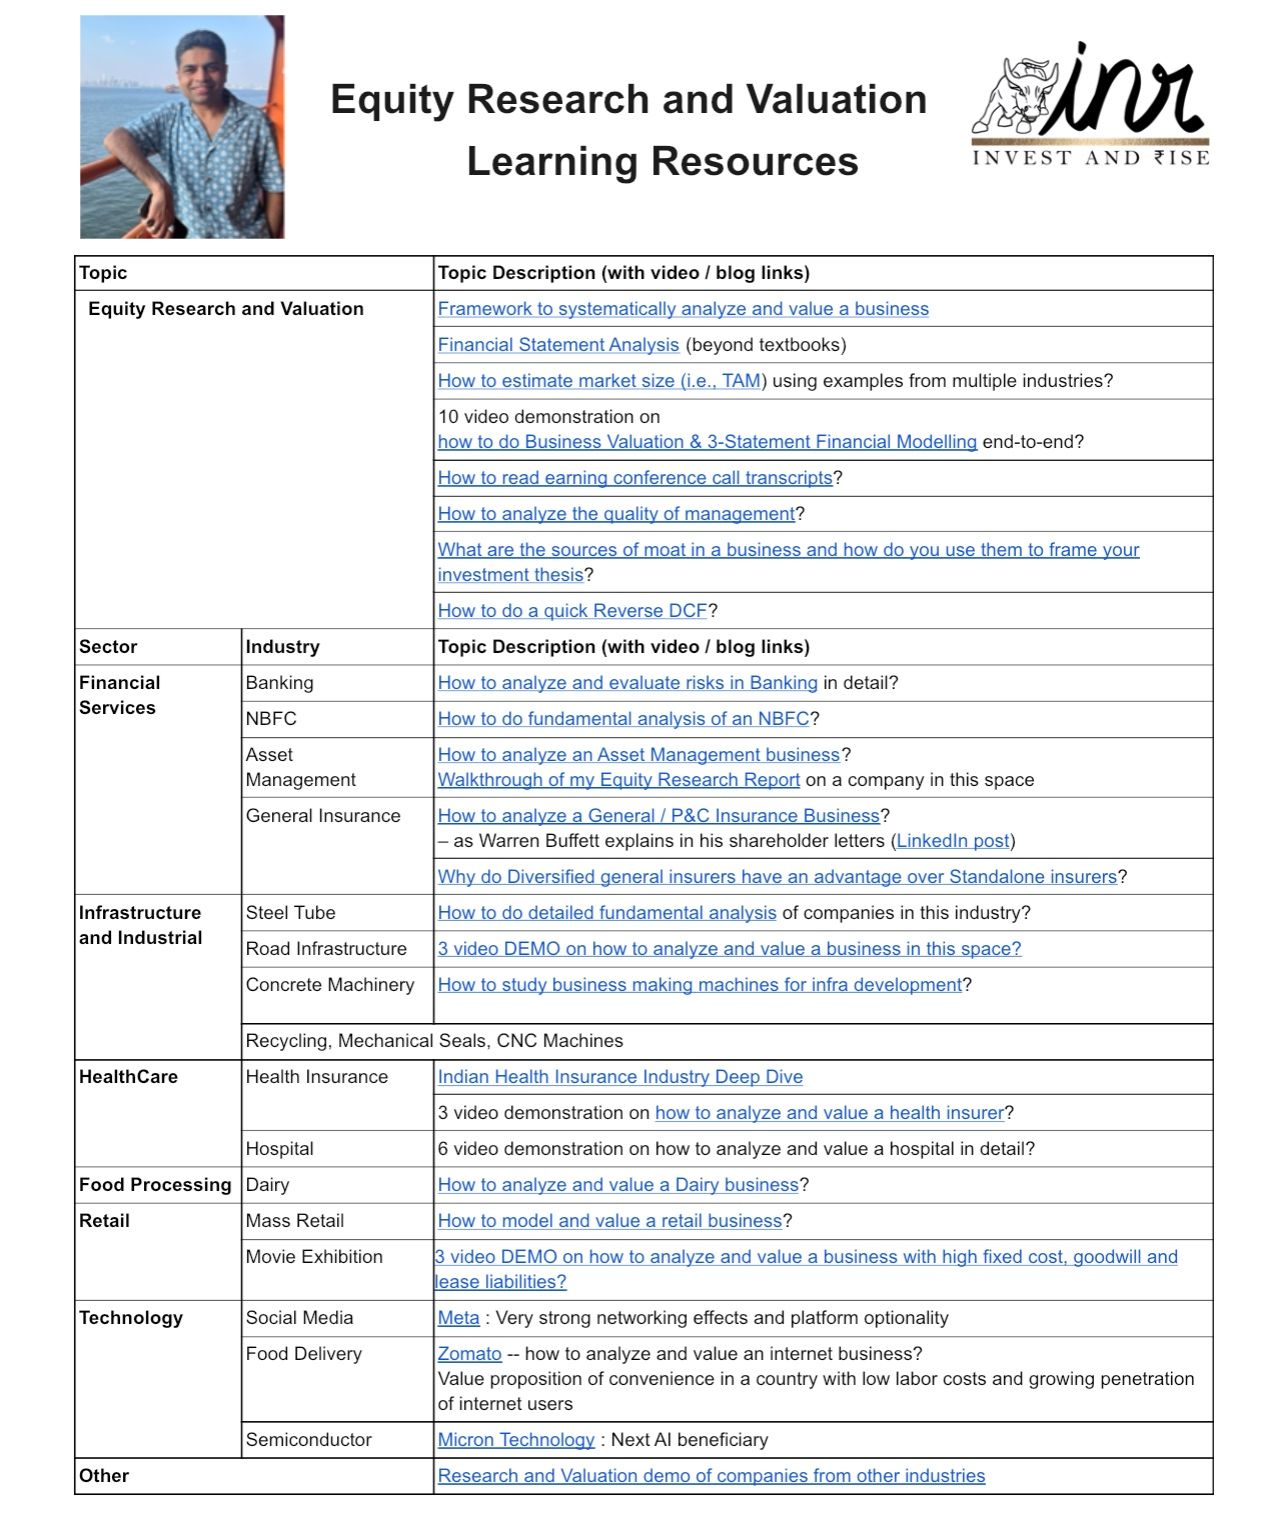
Resources for Investors, Equity Analysts, and Strategy Consultants
Sep 9, 2025
How to do Fundamental Analysis of General/Health/Property & Casualty Insurers?
Sep 9, 2025
Resources to help investors, aspiring equity research analysts and finance focused strategy consultants
Sep 9, 2025
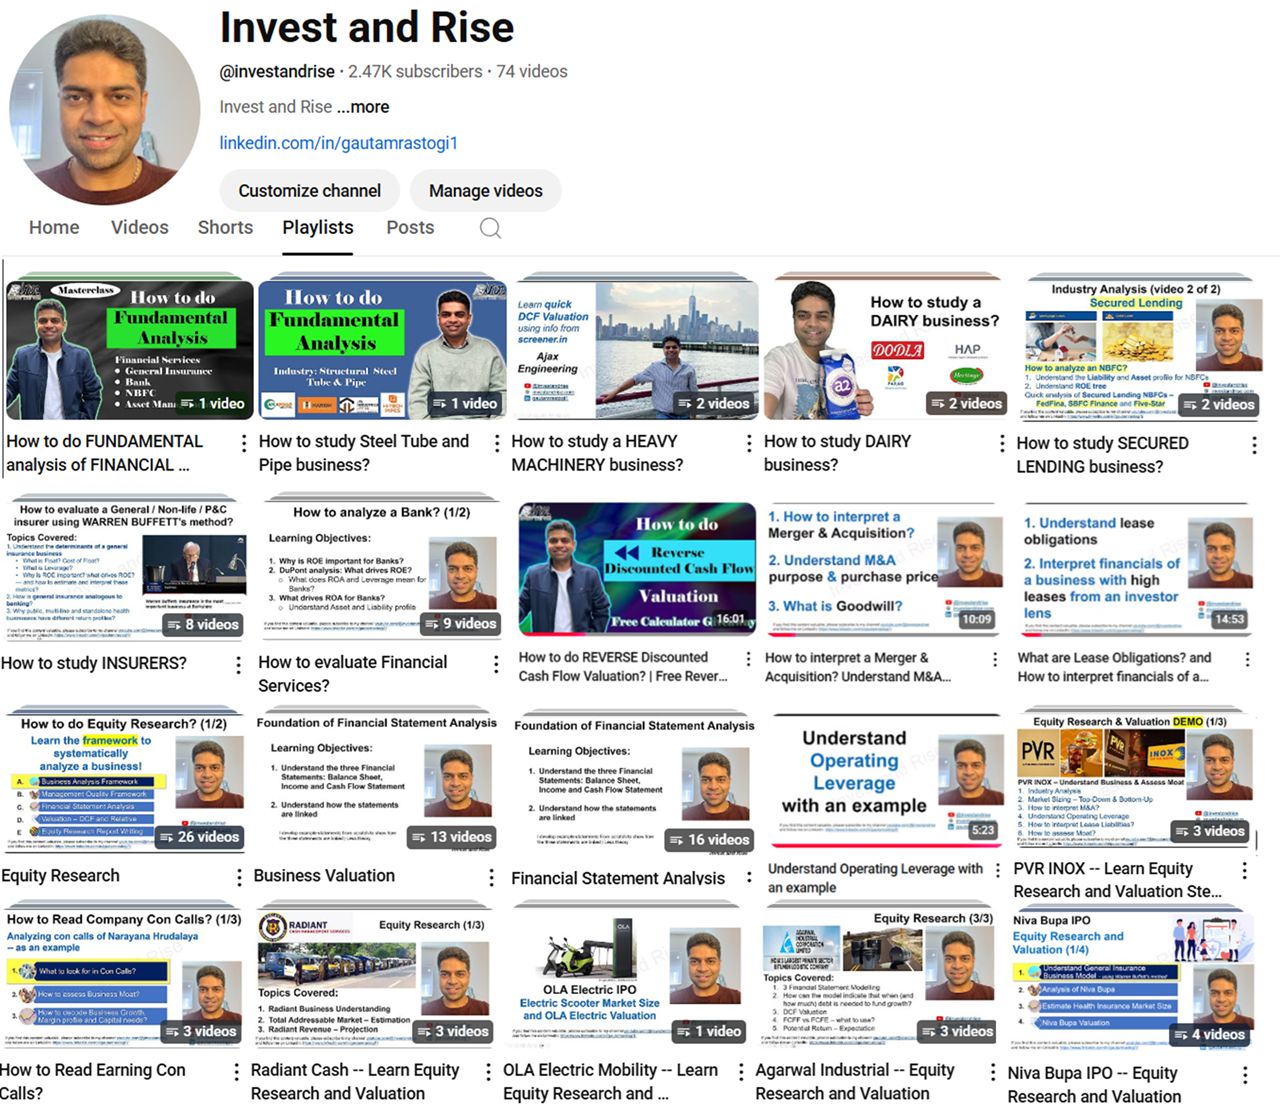
Masterclass on how to do Fundamental Analysis of Financial Services – Insurance, Banks, NBFCs and Asset Management Companies
Sep 9, 2025
How to analyze a Dairy business?
Sep 9, 2025
Allison Transmission: Equity Research and Valuation
Sep 8, 2025
Reverse DCF is a quick and dirty way to assess if a company is over or undervalued
May 27, 2025
1
2
3
…
6
Next Page
Connect with us
Please enable JavaScript in your browser to complete this form.
Please enable JavaScript in your browser to complete this form.
Email Name Comment
Name
*
First
Last
Email
*
Comment or Message
Submit
CLOSE