Skip to content
Courses
Blog Posts
Tag:
#DCF
Concept of Operating (De) Leverage explained through movies!
Sep 10, 2025
How to estimate market size–top-down and bottom-up?
Sep 9, 2025
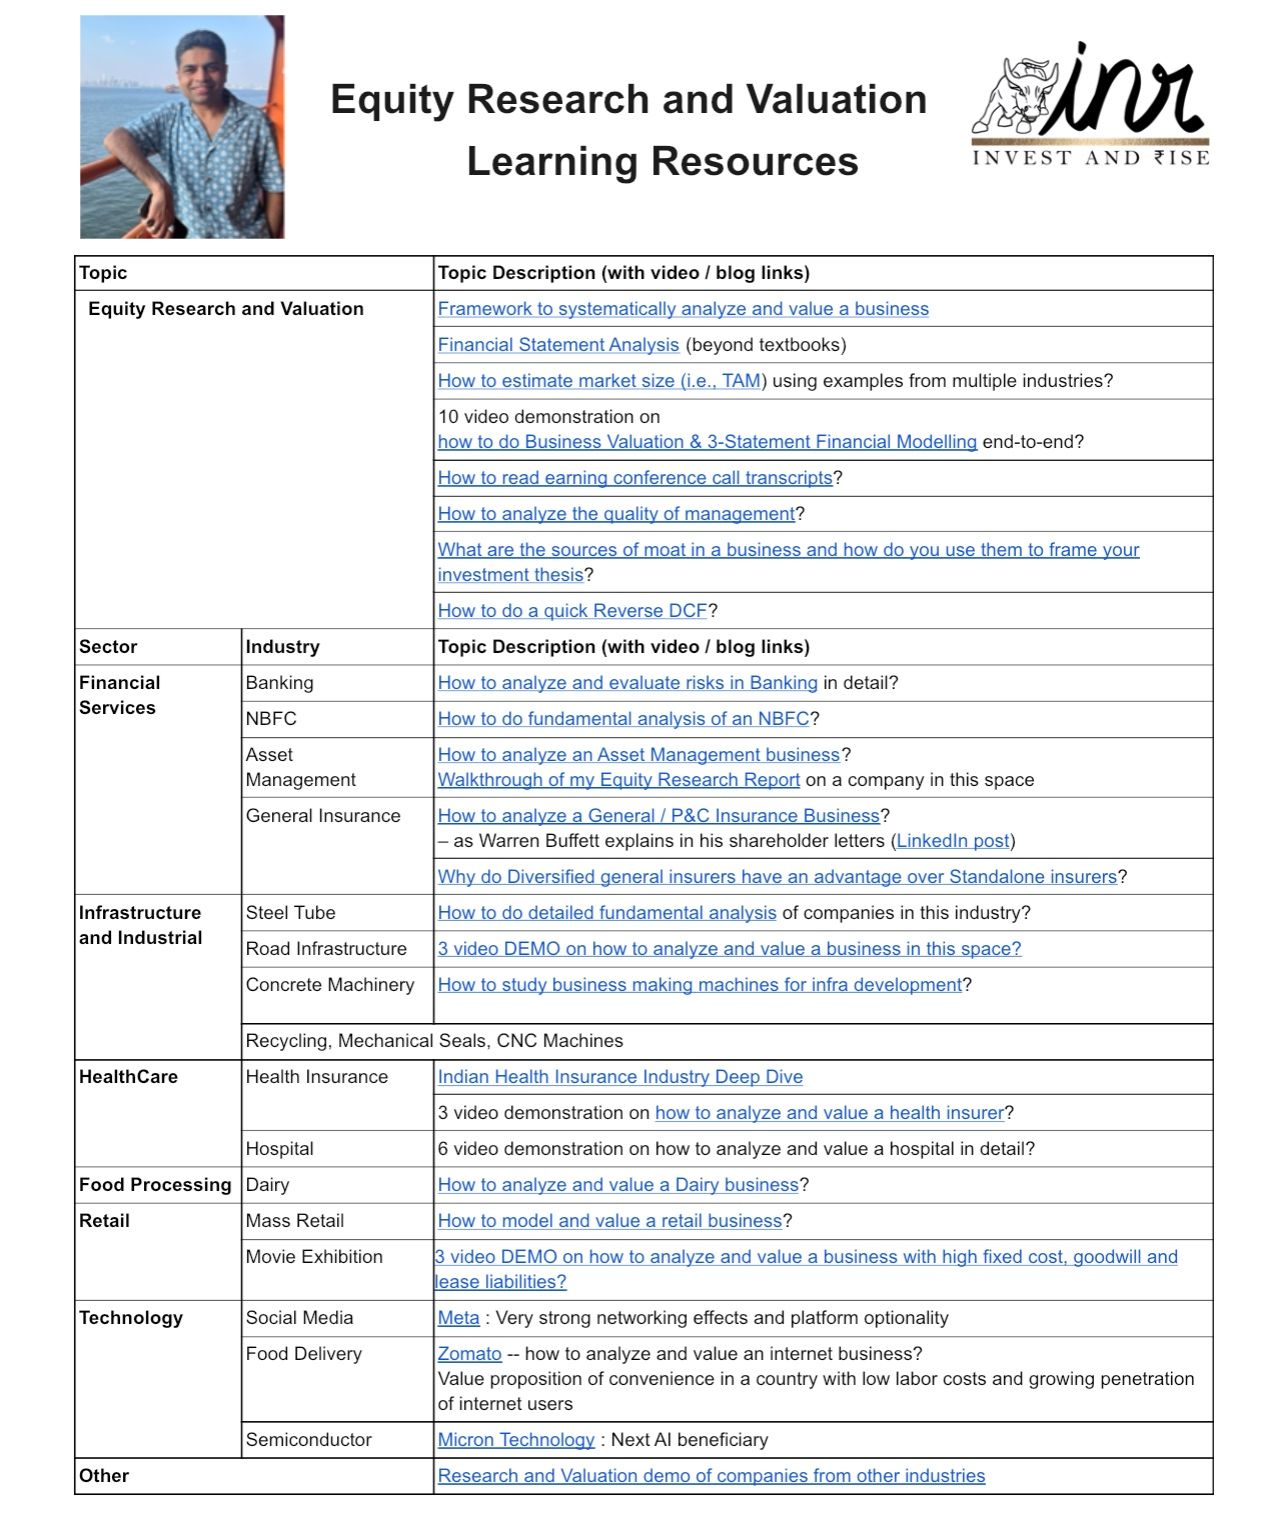
Resources for Investors, Equity Analysts, and Strategy Consultants
Sep 9, 2025
Resources to help investors, aspiring equity research analysts and finance focused strategy consultants
Sep 9, 2025
Reverse DCF is a quick and dirty way to assess if a company is over or undervalued
May 27, 2025
𝗟𝗲𝗮𝗿𝗻 𝗾𝘂𝗶𝗰𝗸 𝗗𝗖𝗙 𝗩𝗮𝗹𝘂𝗮𝘁𝗶𝗼𝗻 𝘂𝘀𝗶𝗻𝗴 𝗶𝗻𝗳𝗼 𝗳𝗿𝗼𝗺 𝘀𝗰𝗿𝗲𝗲𝗻𝗲𝗿.𝗶𝗻
May 27, 2025
PVR INOX Equity Research and Valuation DEMO
Mar 20, 2025
Interested in learning equity research and valuation step by step – through practical examples?
Mar 20, 2025
Balance sheets are forgotten during Bull markets!
Mar 19, 2025
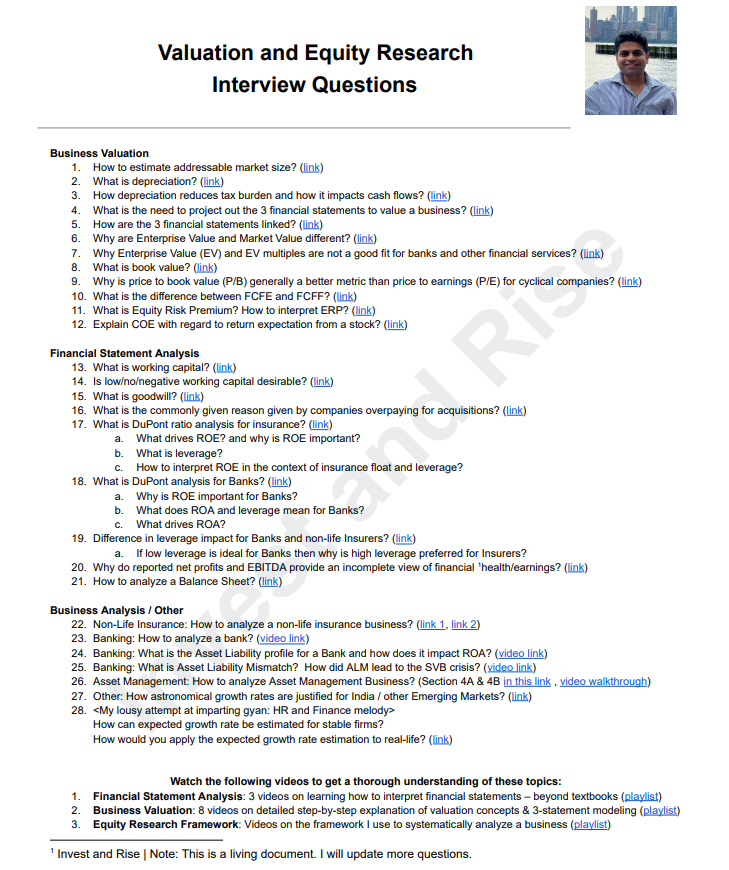
Valuation and Equity Research – Interview Questions
Jul 2, 2024
1
2
Next Page
Connect with us
Please enable JavaScript in your browser to complete this form.
Please enable JavaScript in your browser to complete this form.
Name
*
First
Last
Name or Comment
Email
*
Comment or Message
Submit
CLOSE