Equity Research and Valuation Learning Program
If you are a student or a working professional aspiring to learn skills needed to get in equity research, investment banking, financial analyst or finance focused strategy / consulting roles, then you can count me as a mentor.

Concepts explained through live exercises

Quality and well researched content — focused on practical skill development

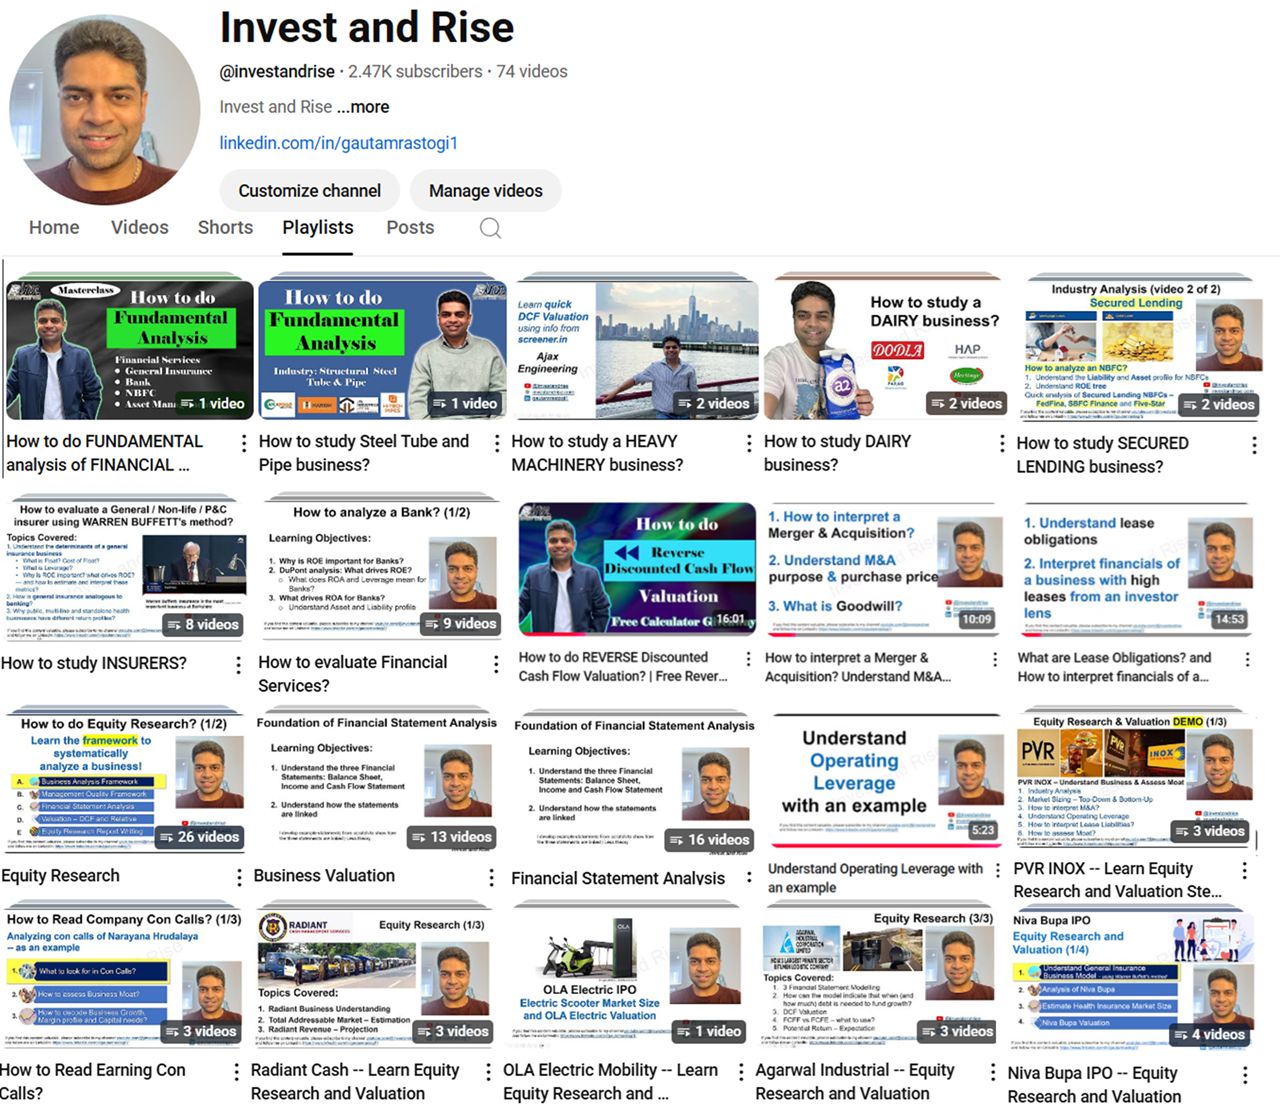
Diverse industries covered

Growing community
Courses Offered

Equity Research and Valuation – Live Sessions
This course is designed to train you to become a hands-on analyst. It is suited for anyone aspiring to learn skills needed to get into financial analyst, equity research, investment banking and finance focused strategy / consulting roles. In this course, you would go beyond textbooks and learn practical skills that you can apply to thoroughly research and value a business. Please note that I do not provide placement assistance, but I can certainly help you prepare for interviews and shape your resume (if you need)
Duration
Intensive 12-week program
Availability
This course is offered twice a year. Next batch to begin in May 2025
course outline
Please note that the Research part in “Equity Research and Valuation” involves detailed research of the industry, market size, and business of the company. This understanding is instrumental in coming up with reasonable inputs to the valuation model. A model is as good as its inputs.
I have spent a lot of time in this program in explaining the Research or the Business Analysis part along with building a valuation model.
This is a practical / hands-on program. I have strived to keep theory to a minimum and covered concepts through live exercises. This is the link to the session-wise course outline: https://docs.google.com/document/d/12mhqa322X_GKvEHlJIbEAQmA74dcECKch9Y6OTc-jKk/

Equity Research and Valuation – Recorded Sessions
You have the option to go for the recorded course, which you can access immediately. This course is designed for you to complete at your own pace. Every week, 2 modules will be released and you are expected to go through them within the week. Towards the end of each week, I will be available for a 30 – 45 mins live call to clear any doubts or review your work (of course, you can text me your doubts during the week as well — that I will try to clear as soon as I can). By the end of 12 weeks, you will have the recordings of all sessions.
Duration
At your own pace. I’d be available to clear your doubts at your own pace i.e., even if you go beyond 12 weeks
Availability
You get immediate access
course outline
Please note that the Research part in “Equity Research and Valuation” involves detailed research of the industry, market size, and business of the company. This understanding is instrumental in coming up with reasonable inputs to the valuation model. A model is as good as its inputs.
I have spent a lot of time in this program in explaining the Research or the Business Analysis part along with building a valuation model.
This is a practical / hands-on program. I have strived to keep theory to a minimum and covered concepts through live exercises. This is the link to the session-wise course outline: https://docs.google.com/document/d/12mhqa322X_GKvEHlJIbEAQmA74dcECKch9Y6OTc-jKk/
Student Testimonials

Rather than being a monotonous, one-way lecture, the sessions were dynamic and bidirectional. One of the highlights was the diverse range of industry models we explored. The practical exercises were incredibly hands-on, and the live, end-to-end modeling reinforced our learning in such a way that, by the end of the course, I wasn’t just theoretically informed—I was practically empowered to analyze and value companies independently. The course also provided a platform to connect with like-minded professionals, expanding my network.
This course was a game-changer for me! I will join any future advanced courses Gautam may host in a heartbeat! Thank you, Gautam!


1. The entire course structure was apt and beginner-friendly, with concepts of each session building onto the next, which helped in both in retention and application of the concepts. 2. Since the cohort size was small, the sessions were structured more like discussions, where ideas of the participants could be discussed and deliberated upon rather than a typical one-way session. 3. The concepts being taught were followed up with real-life applicative examples, covering a wide spectrum of industries and companies. This diversity helped in building a solid foundation, as well as being able to analyze different companies from diverse perspectives. 4. The concepts being taught were quite in-depth, plus the hands-on learning exercise was quite engaging. This helped in building conceptual clarity, since sometimes you are able to understand a concept but you are not able to translate that onto a spreadsheet or even apply that to a real-world public company. 5. The entire course focused on understanding businesses, rather than modeling a business. The sessions covered each and every aspect about a business, from its business model, growth plans, position within its industry, industry growth metrics, macroeconomic factors etc. This helped build a structured approach for analyzing a particular company/industry.
Read more “best learning experiences for someone just starting out”

What I like about the course is the knowledge of the subject, teaching with real examples, not in a bookish way, and the availability to hear and solve queries.
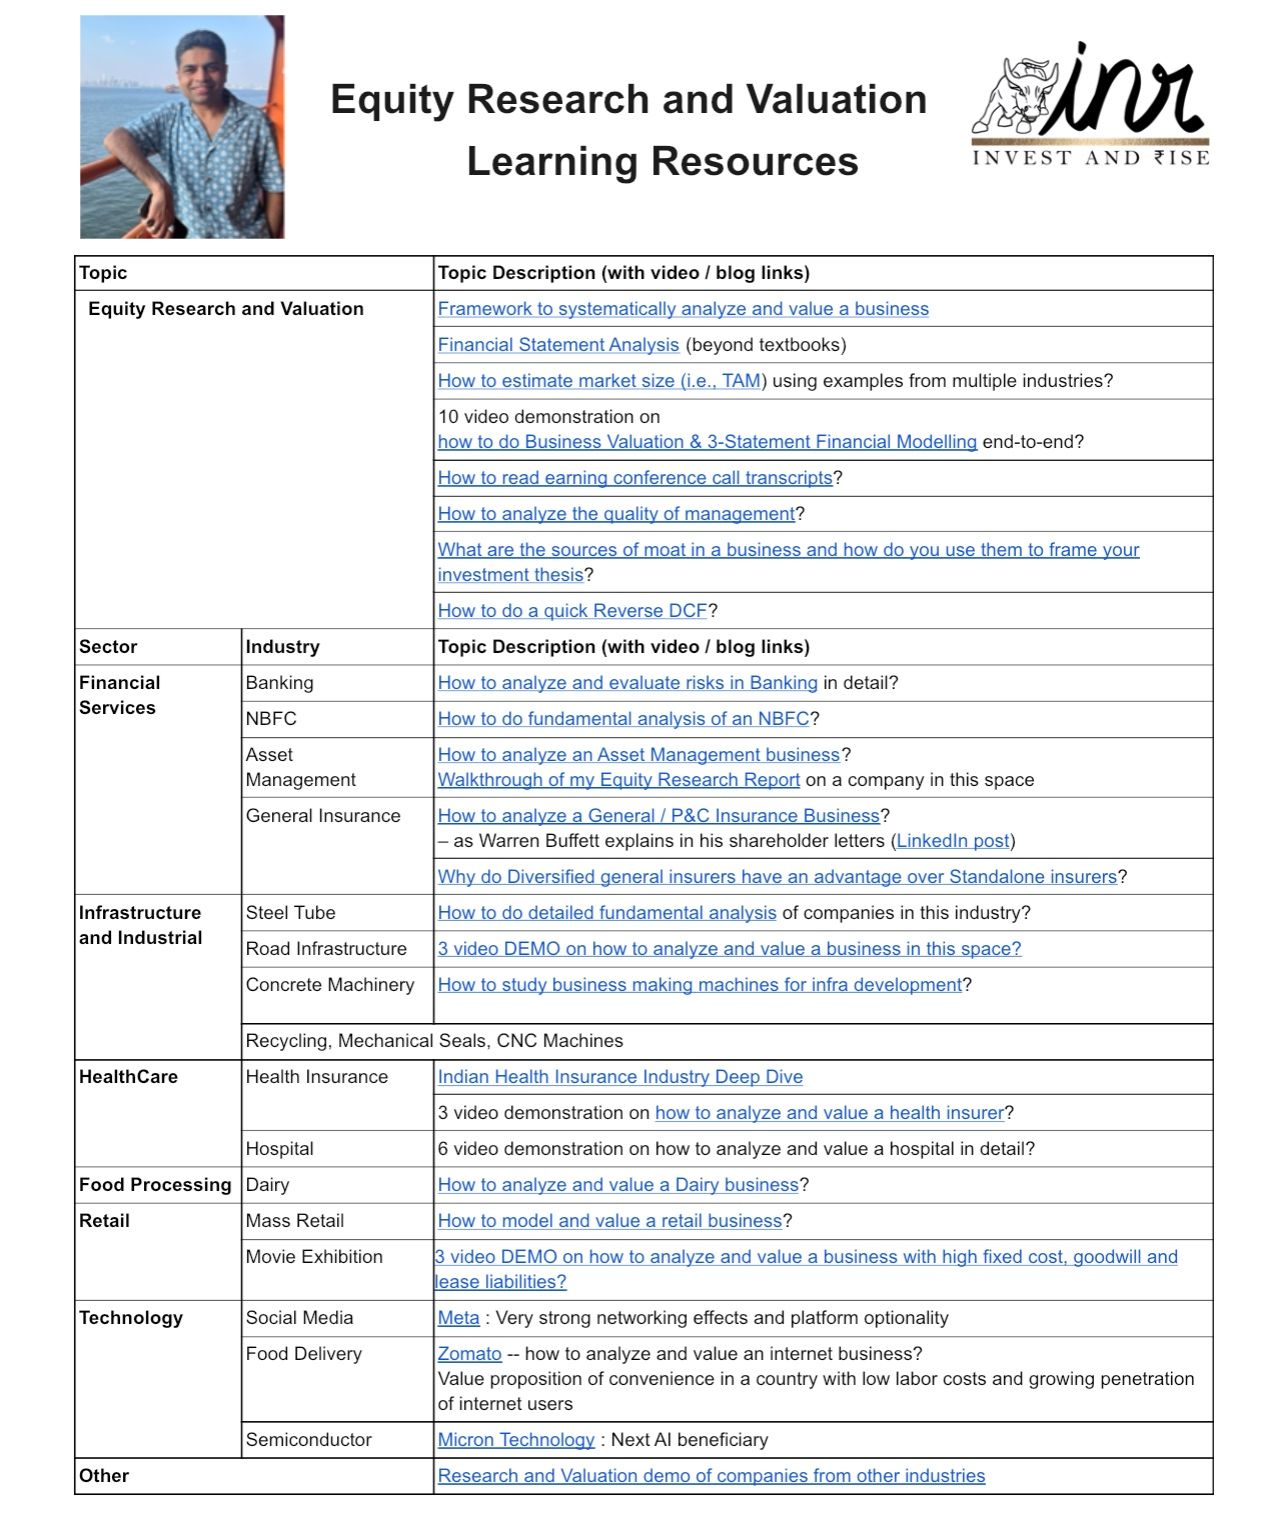
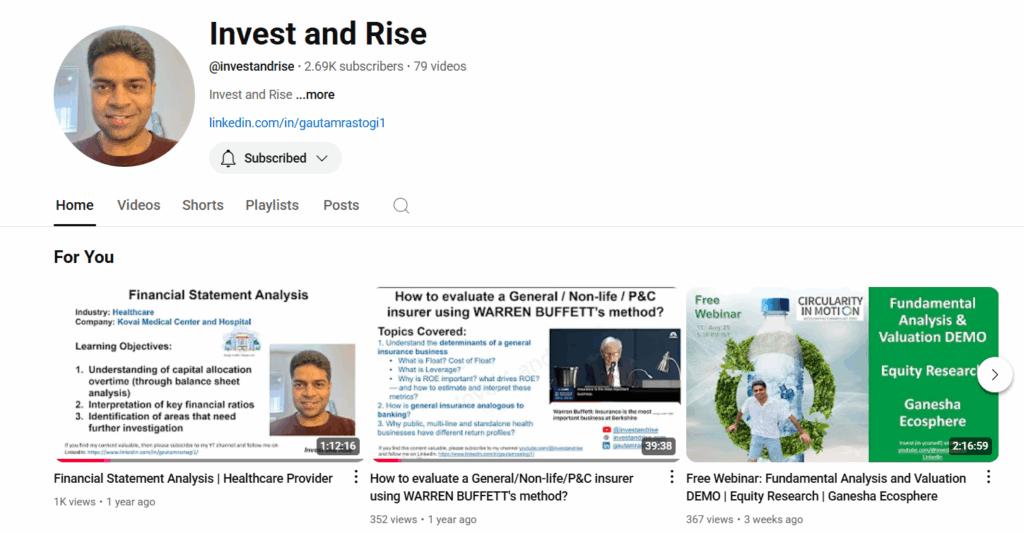
Click on “Blog Posts” alongside to access my equity research and related education content